EcoJustice
While discussing what we did over the summer, one of my friends described his visit to a graveyard in Africatown, Alabama. There, he documented the gravesites, and learned about the environmental racism that occurred there. This includes the surrounding paper mills, asphalt plants, petrochemical storage, and other heavy industries that led to increased rates of cancer and the deaths in the graveyard. He told me about the legacy of redlining and zoning laws which allowed heavy industries to be placed right next to residential homes.
When I learned about this, I was inspired to make this app in order to attempt to prevent future instances of environmental racism.
Africatown was founded by formerly enslaved Africans who arrived on the last known slave ship to the United States, the Clotilda, in 1860. Despite its profound historical significance, the community has been subjected to decades of industrial encroachment and pollution.
Today, residents continue to fight for environmental justice while preserving their unique cultural heritage. Their struggle exemplifies why tools like EcoJustice are necessary to identify patterns of environmental inequality and empower communities to advocate for change.
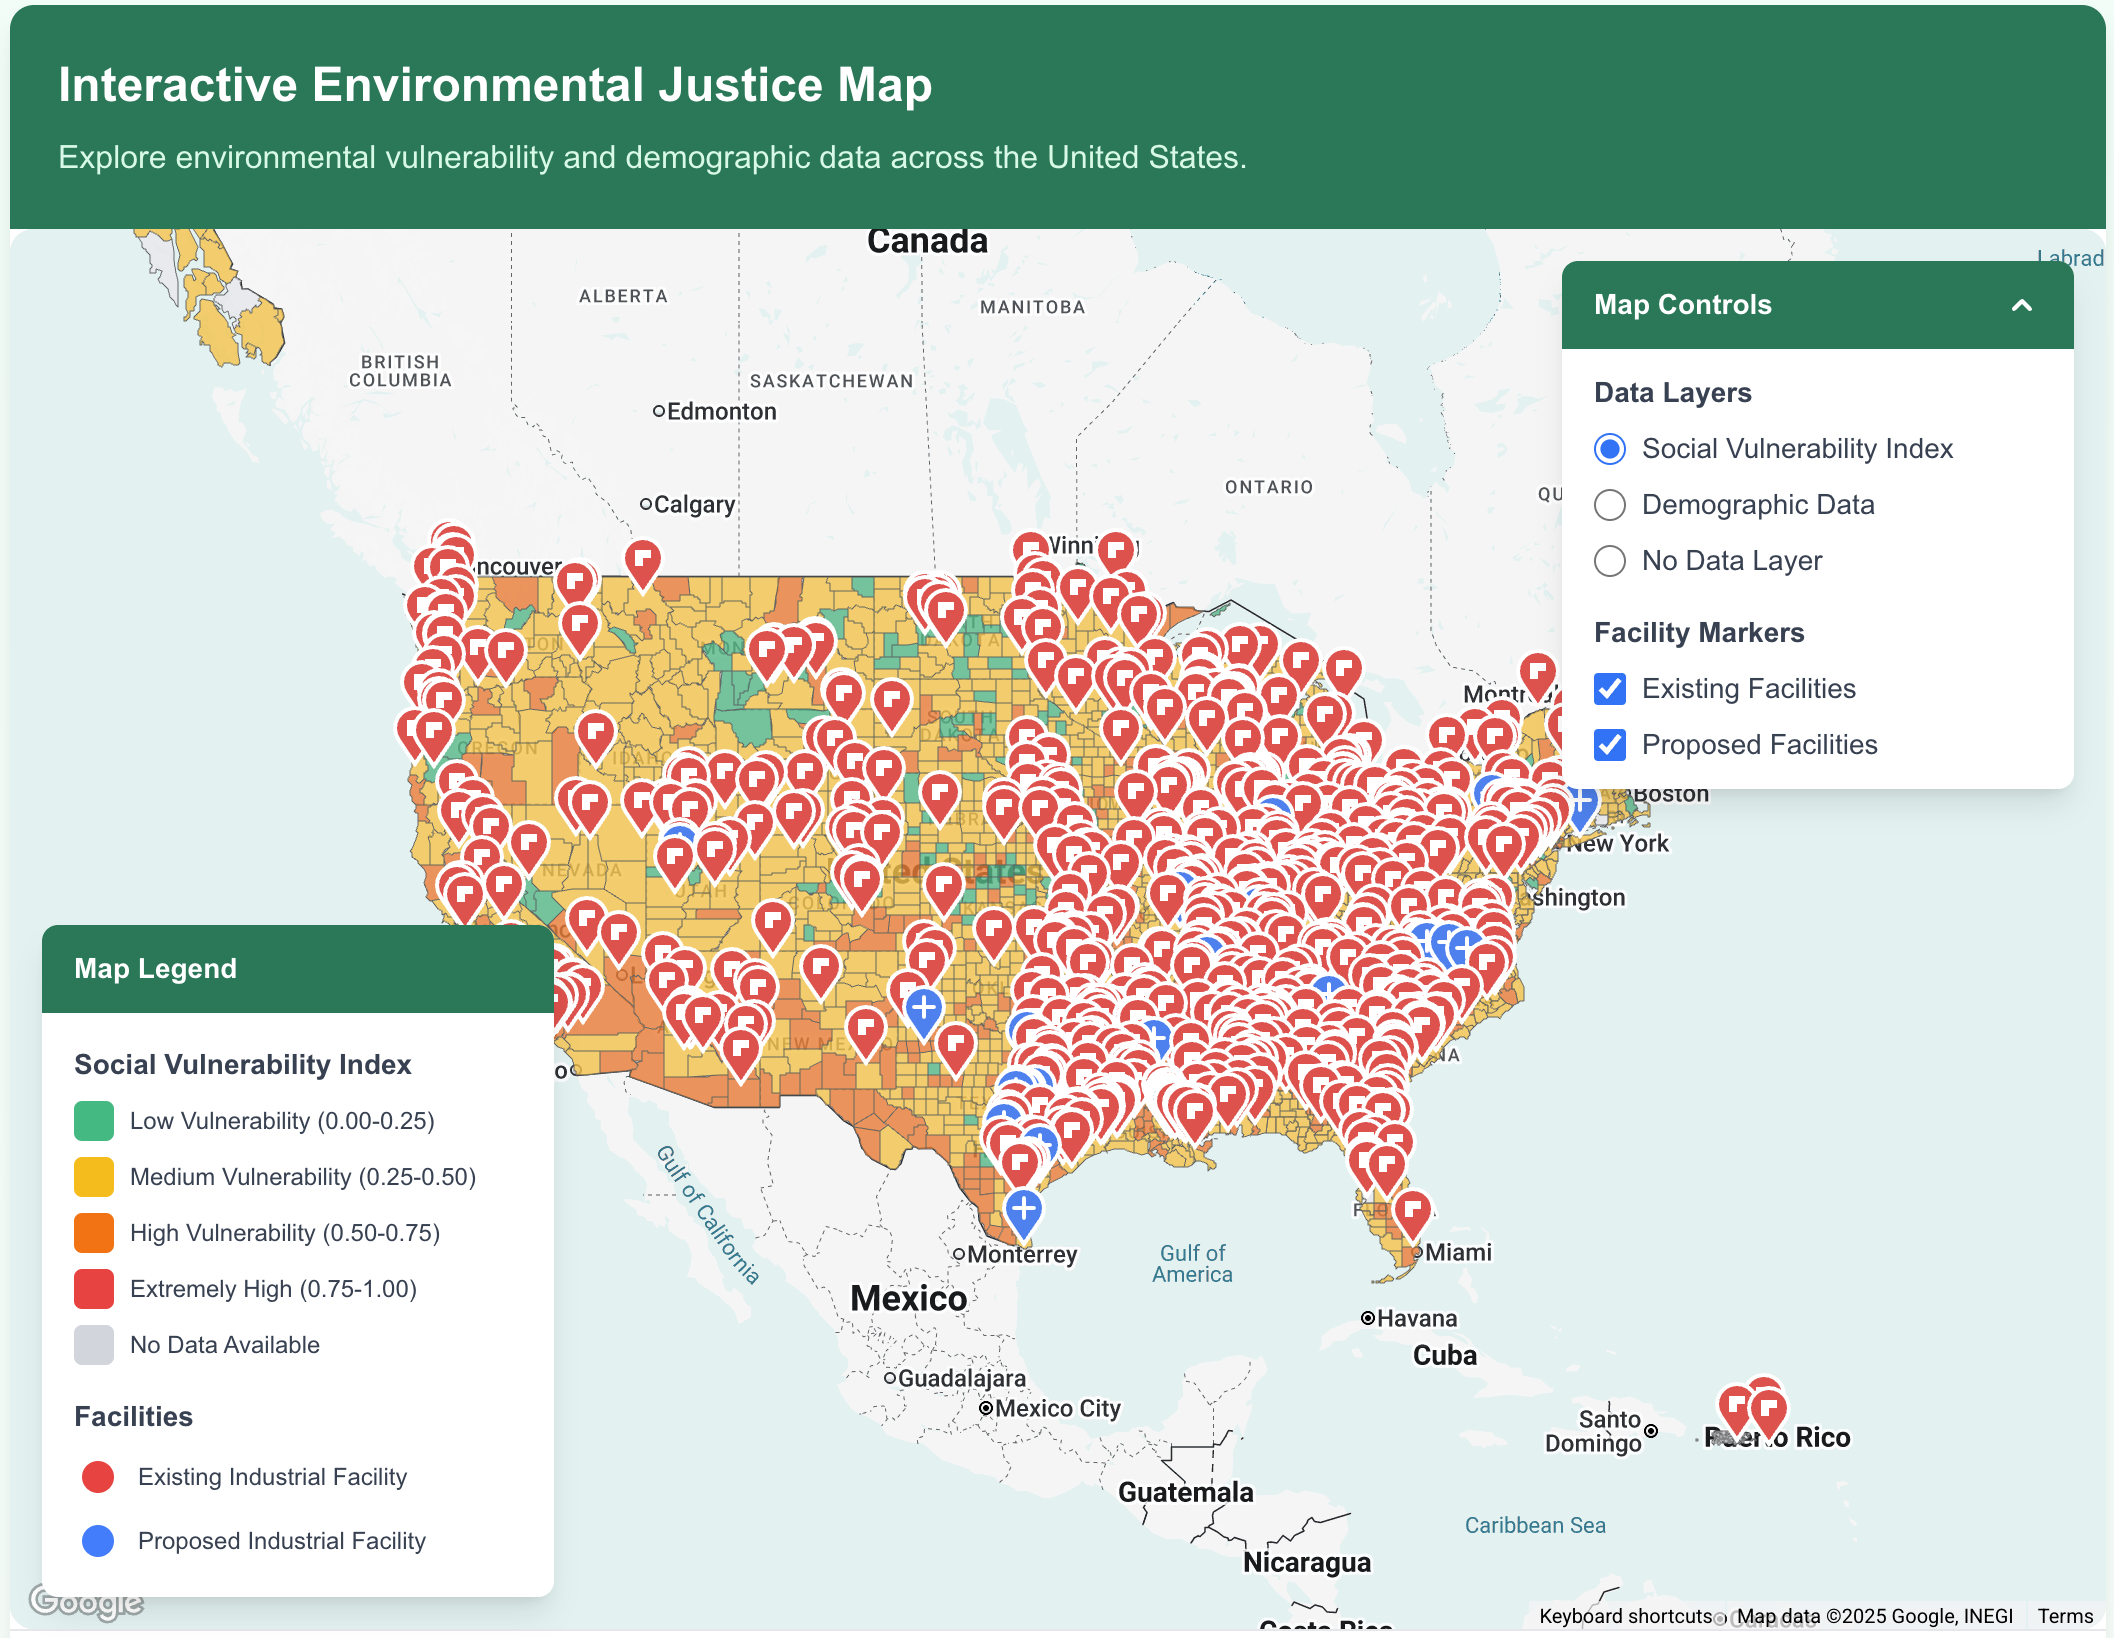
What it does
EcoJustice leverages data from the CDC, EPA, and Census Bureau, combining it all into one easily digestable map. Features include a Social Vulnerability Index calculated using 16 data points from the CDC, demographic data on minority majority counties from the Census Bureau, and existing/proposed polluting facilities around the United States. With this tool, users can view potential proposed legislative and zoning bills that would pollute their communities, taking action using our toolbox which includes an AI Letter generator for direct communication with local representatives. For easy delivery, I also utilized Google’s Civic Information API, bringing easy access to change.
How I built it
I built EcoJustice using Next.js as my framework, leveraging Tailwind CSS and Framer for styling/animations. For API’s, I utilized Google’s latest lightweight generative AI for targeted letter generation, Google’s Civic Information API for gathering local representatives, and Google Maps API for the geospatial mapping.
Challenges and Accomplishments
One of the biggest challenges I ran into was gathering and enriching the vast amounts of data that was online. Given that the United States is such a large country, there was an unwieldy amount of data that had to be collected, then altered to fit my application.
I’m proud of eventually handling all the data and using it in a productive way that brings light to social justice issues evident in our communities. I realized that there’s vast amounts of enlightening data out there, just waiting to be found.